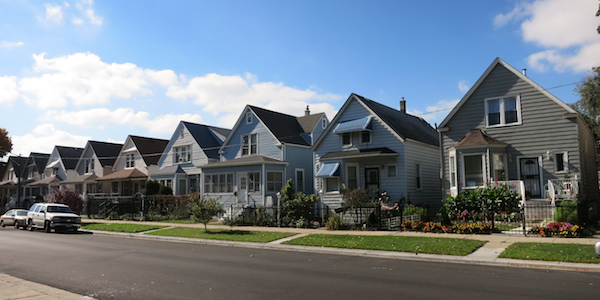
The share of middle-income adults significantly shrank from 2000 to 2014. The Pew Research Center examined 229 of the 381 U.S. metro areas and found that in 203 of them the number of adults living in middle-income households fell over the last 14 years.
The metro areas for Atlanta (56.0 to 50.5), Baltimore (57.5 to 51.3), Boston (55.9 to 48.6), Chicago (56.3 to 51.1), Milwaukee (58.9 to 52.6), Minneapolis (61.0 to 54.6), Philadelphia (56.1 to 50.6), and San Francisco-Oakland (52.7 to 47.7) all saw their share of middle-income adults decrease by at least 5 percentage points from 2000 to 2014. Dallas, Denver, Houston, Indianapolis, Los Angeles, Memphis, Miami, New York, Pittsburgh, San Diego, and St. Louis also saw declines in the middle class.
The conclusion tracks with a Pew study released late last year, which found that the number of adults in middle-income households in the U.S. decreased from 55 percent in 2000 to 51 percent in 2014.
With a smaller middle class, percentages increased for both upper- and lower-class adults. The upper-income tier rose in 172 areas, and the lower bracket increased in 160 areas. Some 108 metros saw rises in both categories.
In the study, a middle-class household was defined as a household income two-thirds to double the national median, adjusted for household size. This worked out to be a range of between $42,000 and $125,000 for a household of three. The median income was between $70,000 and $75,000 in 138 of 229 areas.
Incomes in each metro area are adjusted for the cost of living relative to the national average. The 229 metro areas, selected because of publicly available Census Bureau data sets in both 2000 and 2014, represent 76 percent of the U.S. population in 2014.
Pew identified the areas that gained and lost the most economic status since 2000. Midland, Texas, for instance, went from an 18.5 upper-class share to a 36.8 share from 2000 to 2014 due to a population surge from the oil and gas industry. Midland’s middle-class rate shrank from 53.3 to 42.6 percent in the same timeframe. Meanwhile, industrial cities such as Goldsboro, N.C., suffered. Goldsboro’s lower-income share went from 27.2 to 40.9 from 2000 to 2014; its middle-income rate declined from 59.6 to 47.8.
The areas with the greatest share of middle-income adults are located in the Midwest. In Wausau, Wis., 67.2 percent of adults were considered middle class in 2014. Janesville-Beloit, Wis. (65.2), Sheboygan, Wis. (63.2), Kankakee, Ill. (62.1), Elkhart-Goshen, Ind. (61.4), Eau Claire, Wis. (61.2), and Youngstown-Warren-Boardman, Ohio-Pa. (60.2) were among the metros with a middle-income share greater than 60 percent.
Advertisement
Related Stories
Construction
Proven Ways to Improve Jobsite Productivity
Consider these solutions for reducing cycle time, hard costs, dry runs, rework, miscommunication, and overall inefficiencies on the jobsite
Affordability
What Are Our Affordable Housing Options? Really
There are a range of ideas out there for addressing the housing affordability crisis. And while offering more housing choices is great, which of those are truly solutions to affordability?
Business Management
Happiness and 'The Bear'
Can happiness be the core strategy of a home building business? It can ... and it probably should be


