Home Affordability Report Shows Increased Pressure for Attainable Housing

Unmet demand for housing continues to drive home prices higher, as median sales prices on homes in the U.S. have risen for the 10th straight year. These increases are putting pressure on housing affordability, which continues to trend downward (see chart, below), according to the ATTOM U.S. Home Affordability Report. In the first quarter of 2015, homebuyers on average needed just 18.4% of their wages to buy a median-priced home, but that share rose to 25.2% in the fourth quarter 2021, continuing an upward trajectory that inches closer and closer to the “unaffordable” designation at 28%—which is often the tipping point for when lenders become reluctant to issue a mortgage loan.
Home Affordability Trends
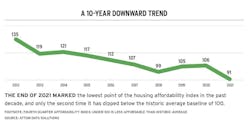
Without an increase in the supply of homes and condominiums for sale, this percentage may continue to grow, especially as the pandemic has many potential buyers seeking a safe place to stay and space to work from home. Historically low interest rates on mortgages, combined with rising wages, have helped keep homebuying in the affordable range (less than 28% of wages, on average) ... for now.
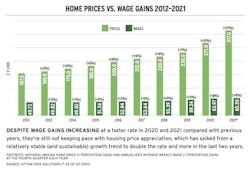
Wage Growth vs Home-Price Appreciation
A key metric to keep an eye on is wage growth versus home-price appreciation (see chart, below). In Q3 2021, home prices were growing faster than wages in 78% of the counties surveyed. If that trend continues, housing affordability will be a serious concern for much of the country.
RELATED
- ‘Worst Ever’ Market for First-Time Buyers, Experts Say
- Consumer Price Index Points to Elevated Inflation and Higher Interest Rates in 2022
- Solutions to Housing Affordability
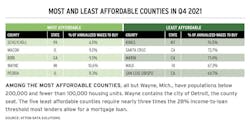
Home Affordability and Location
Of course, location is a critical factor in housing affordability. Buying a home in Kings County (home to Brooklyn), N.Y., requires 76.5% of wages for the average worker, but buying a home in Schuylkill County (outside of Allentown), Pa., requires just 6.5%. As remote work makes some segments of the workforce more mobile, demand may increase in locations where homebuying is a more affordable endeavor.
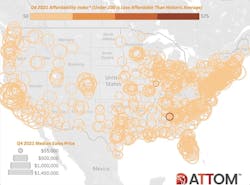
Methodology and Respondent Information: The ATTOM U.S. Home Affordability Index analyzes median home prices and average wage data in 575 U.S. counties with a combined population of 252.6 million. The affordability index is based on the percentage of average wages needed to pay for major expenses on a median-priced home with a 30-year fixed-rate mortgage with a 20% down payment and a 28% maximum “front-end” debt-to-income ratio. “Major expenses” include property taxes, home insurance, mortgage payments, and mortgage insurance.