Home Building by the Numbers: Financial and Operations Analysis

At the outset of 2020, Emma Shinn felt confident that home builders were poised to have a “super” year. Back then, demand looked promising, and builders were controlling their operating expenses.
Shinn, perhaps more than most housing industry prognosticators, had the advantage of historical perspective. As VP of The Shinn Group, a consulting practice based in Littleton, Colo., co-founded with her husband, Chuck Shinn, she has been tracking and publishing the financial and operational ups and downs of home builders since 1994.
Comparative Financial and Operations Analysis for Benchmarking and Forecasting
The annual analysis, called the Comparative Financial and Operations Analysis (“Fin-Op” for short), draws from detailed information about various revenue, cost, and profit metrics provided anonymously by builders of varying sizes in different locations, serving as a benchmarking and forecasting tool for the company, builders, and the industry.
RELATED
- 2021 Housing Forecast
- Data-Driven Builders Leave the Guesswork Behind
- Predicting Profit: How to Know Your Margin Before You Close
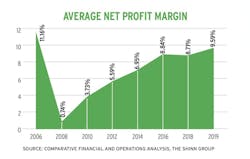
In 2019, for example, the average profitability among the builders surveyed rose to 9.59% of revenue, up from 8.71% in 2018—the best performance since 2006, before the crash (see chart 1). Shinn’s analysis attributed the boost in 2019 to reductions in costs of sales and operations, while financing expenses were at all-time lows. Nearly one-quarter of the builders surveyed met or exceeded 12% net profit, which The Shinn Group targets for balanced performance.
Hindsight was never more valuable than after the World Health Organization declared COVID-19 a pandemic in March 2020, and the economy went topsy-turvy. However, says Shinn, builders let optimism coming out of 2019 cloud their judgment about growth, and didn’t always heed lessons from the past.
For instance, when the pandemic hit, some builders in The Shinn Group’s clique were operating at 175% capacity to keep pace with demand, a strategy that also helped drive up material and labor costs. At the same time, they generally resisted price increases to stem contract cancellations in light of the crisis, which threw financial balances further out of whack. Shinn speculated that some builders may not have generated sufficient revenue to profitably offset those increasing expenses, in part because COVID-19 virus-related manpower and building product shortages delayed their home closings.
“Cycle time affects general operations,” she explains. As of November 2020, “builders were telling me it’s taking two to four weeks just to get a project permitted, on top of materials delays. Closings for many builders will not be favorable in 2021,” a situation that has only worsened in the months since.
As her organization prepares its 2020 Comparative Financial and Operations Analysis for a release mid-year 2021, Shinn fears the report will reveal that those factors will have lopped off two to four percentage points of net profit across her builder network.
Key to Profitability: Balance Through Constant Adjustment
What makes a builder consistently profitable? The universal conclusion, year after year, says Shinn, is “excellence in operational processes and procedures, and discipline during execution,” abetted by keeping cost of sales at or below 70% of revenue and gross profits (before such costs as indirect construction, financing, and sales and marketing) at or above 30%.
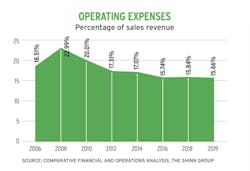
In 2019, builders needed to adjust their operating expenses to match a falloff in volume and a decline in sales prices. As most operating expenses are fixed, less revenue requires less spending to stay in balance. Shinn says the companies that kept their operating expenses at or below 15% of revenue that year usually found that equilibrium.
Over the decades, The Shinn Group’s analysis has evolved, too, often in response to builder feedback. In 2001, it began tracking sales conversion rates. Two years later, it started tracking Working Capital Turnover (an indicator of a company’s ability to expand) and Capital Turnover (a measure of how effectively a builder deploys personal investments). In 2007, The Shinn Group added a survey question about sales contract cancellation rates.
Compensation is one of four sections in the 2019 version of the survey and analysis; the others are financial, operational, and insurance. The respondents’ financial information, which follows the format of the National Association of Home Builders’ Chart of Accounts, is broken down into five major ratio categories: profitability, efficiency, liquidity, leverage, and return on investment. The analysis gauges each respondent’s performance against established target ratios (see “Range to Target,” below).
Picking Up on Patterns to Reveal Trends
With so much data at its disposal, The Shinn Group’s analysis has been able to identify patterns that sometimes reveal trends, such as:
- Since 2011, operating expenses have decreased, in line with reduced sales volumes (see chart 2).
- Financing expenses peaked in 2008. But Shinn cautions builders to watch out for future increases stemming from longer cycle times.
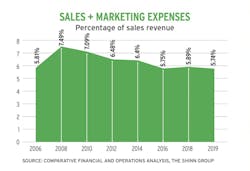
- Sales and marketing expenses have continued to decline, as a percentage of revenue, since 2016 (see chart 3). Part of the reason is a greater reliance on electronic media, which accounted for 38% of builders’ advertising spending in 2019, and the advent of virtual reality to sell houses.
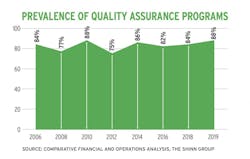
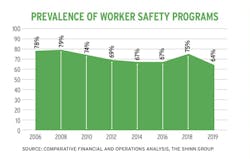
- An “alarming” trend in 2009 that saw builders backing away from quality assurance programs has significantly reversed itself (see "Prevalence of Quality Assurance Programs" chart, below). But the analysis also found troubling inconsistencies in builders’ worker safety programs: 64% of builders had programs in place in 2019, versus 75% the previous year (see "Prevalence of Worker Safety Programs" chart, below).
- Since 2015, as customization has become a more prevalent eddy in their revenue streams, builders have been more willing to meet with homebuyers during the sales and construction stages.
The sheer amount of data collected also lends itself to intriguing mashups, such as comparing the average selling price of homes to the average days of contract-to-start and start-to-close, superintendents’ experience, and the cost of first-year warranties. Another ratio compares employee compensation by job title with gross revenue—all of which helps Shinn advise its members and others, as well as provide builders with reliable historical data to make strategic decisions going forward.
Early Warning Signs for Threats to Profitability
Some may argue that looking at builders’ performance through a rearview mirror, regardless of how deep the focal points, only tells you where you’ve been, not where you’re going.
Shinn, though, insists that her organization’s analyses are relevant and important. “They give builders a road map for what they need to do to make money,” she says. “It shows them the trends that are current, and whether [their companies] are on the right path or need to make changes.” She notes that, over the years, many builders have used this analysis to show investors and lenders where their companies stand vis-à-vis the rest of the industry.
"They give builders a road map for what they need to do to make money. It shows them the trends that are current, and whether [their companies] are on the right path or need to make changes." — Emma Shinn, VP of the Shinn Group
The analysis, says Shinn, also raises red flags about builders’ actions that could be detrimental to profitability. The 2019 report cited a deterioration in training and other standard processes and procedures, which follows patterns from other periods of growth. And, starting in 2014, there has been an erosion in production systems, particularly those related to processing variance purchase orders, start packages, and the use of master schedules, for which the analysis blames volume increases and leaner staffs.
The Shinn Group’s analysis advocates the greater embrace of technology, whose importance was amplified by the housing collapse that extended from the mid-2000s well into the 2010s, “when some builders’ practices got thrown by the wayside because they didn’t have the people in place,” Shinn says. The recent pandemic has once again brought the technological imperative to the forefront, especially for new-home sales and project management.
Past Is Prologue
Prior to the pandemic, builders that participated in The Shinn Group’s 2019 survey were only using about two-thirds of their production capacities, which meant these companies could have increased their volumes by 33% without having to add more construction depth.
In 2020, it’s apparent that some builders expanded well beyond their capacities, possibly at the expense of gross profitability, which Shinn calls a “first line of defense.” Sustaining profit, she says, is a concern moving forward, per the 2019 analysis. Low interest rates that had “subsidized” builder profits are threatened by economic factors, and as home price ceilings tighten, builders have less wiggle room to absorb increases in land and construction costs.
Despite these caveats, The Shinn Group believes, back in 2019 and still, that the decade of the 2020s is primed for record performances by the home building industry. Living up to that challenge won’t be easy, but as builders reignite their engines in anticipation of a subsiding pandemic, the prescriptions laid out by The Shinn Group’s annual analysis seem like a good place to start.
Profile of a Fin-Op Builder
The 56 responses received from The Shinn Group’s annual financial and operations (fin-op) analysis of home builders primarily within its network breaks down as follows:
Average Gross Revenue: $73.5 million
Average Number of Employees: 42
Average Sales Conversion Rate: 12%
Average Cancellation Rate: 10%
Average Days From Contract to Housing Start: 61
Average Days From Start to Close: 130 (<1800 sf) — 224 (>6,000 sf)
Average Annual Home Closings: 180 units
Average Sales Price: $523,778
Have a Design Center: 70%
Range to Target
Here’s how the 2019 survey respondents fared against fin-op performance targets set by The Shinn Group.
Cost of Sales: Range 58-86%; Shinn target 70%
Indirect Construction Costs: Range 2-5%; Shinn target 3.5%
Financial Expense: Range: 1-7%; Shinn target 4%
Sales and Marketing Costs: Range 2-9%; Shinn target 6%
General and Admin Costs: Range 2-6%; Shinn target 4.5%
Net Profit: Range (-7%)-27%; Shinn target 12%
To purchase a copy of The Shinn Group’s 2019 Comparative Financial and Operations Analysis, click the attachment below to download an order form.