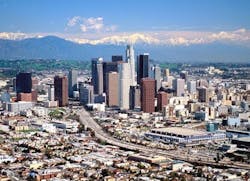
Los Angeles boasts highest urban population density
Recently released data from the U.S. Census Bureau from 2010 reveals that the 41 major urban areas nationwide accounted for 80 percent of the total U.S. population. Analysis by New Geography showed that Los Angeles had the highest population density, housing nearly 7,000 people per square mile.
The highest-density urban areas with populations greater than 1 million included, in order:
1. Los Angeles (6,999 per square mile)
2. San Francisco (6,266)
3. San Jose (5.820)
4. New York (5,319)
5. Las Vegas (4,525)
The average density amongst all 41 major urban areas was 3,245 people per square mile. In total, urbanization covered 106,000 square miles, or 3 percent of the entire U.S. land mass.
In terms of overall population, the top five were as follows:
1. New York (18,351,295)
2. Los Angeles (12,150,996)
3. Chicago (8,608,208)
4. Miami (5,502,379)
5. Philadelphia (5,441,567)
To see the rest of the chart, click here.
