The Trade Shortage: Opportunity Lost ... or Gained?

In my last two Professional Builder columns, “Survey Says,” Part 1 and Part 2, we confronted the responses, and stark consensus, from 167 builders who participated in a brief 10-question survey about the state of the nationwide trade shortage. Among other details, the builders described the labor deficit as a significant margin-killer and declared it will get worse in 2017 before it gets better.
But what do the trades think about all of this? You might guess they have some pretty strong opinions about how builders are working with them in these times of shortage. If only we had some way of measuring that. As it turns out, we do, and the results are sobering.
Back in 2005, prior to the crash that began in 2007, accelerated in 2008, and spun out of control in 2009, TrueNorth launched a survey called “TradeComm”—a supplier/trade feedback system for builders. This in-depth survey was developed around a long-standing model, somewhat modified to better fit the home building industry “subcontractor” approach to labor, then tested and refined. Its purpose was to help builders get direct feedback from suppliers and trades in an organized manner, enabling them to make sense of large amounts of data, determine priorities, then develop action plans. The goal: improved supplier/trade relationships, which would enable builders to attract and keep not just the best trades but the best crews. This critical distinction still escapes the vast majority of our builders.
The TradeComm Survey consists of 45 questions in six categories: Organization, Systems & Support, Feedback, Goals, Values, and Rewards. The categories allow a builder to identify key strengths and opportunities at a more macro level, as they dig down into the detail of each question. Prior to the downturn, 35 builders engaged their suppliers and trades with the survey, typically receiving between 50 and 100 responses. There was a lull during the survival years, but about two years ago, as the industry reemerged and volumes increased, we put the survey out there again.
As trade shortages intensified, builders began to understand the need to fight in more creative ways to gain the best trades in what today is, in any given market, a zero-sum game. Until the supply goes up, if you want more, you must take it from someone else. Although some impressive efforts to develop the trade base on a more macro basis are popping up, that won’t solve your immediate problem. Trying to get a firm handle on what makes a company the “builder of choice,” then working to achieve that, is the only short-term play, other than simply writing bigger checks. If you’re good with option No. 2, you can stop right here.
Then vs. Now
For the rest of you, we just ran our 15th builder through the TradeComm process post-crash, so today we have enough data to compare the scores, then and now. Stop here a minute and ask, regarding how builders run their companies: Have we gotten better or worse since the crash? We learned a lot, right? Any reasonable person would suspect we have improved on the whole or, at the very least, it’s a mixed bag, some up, some down. But, as you’ll see, that reasonable person would be almost perfectly wrong, with just one question showing an improvement and three statistical “dead heats” out of 45 questions. In short, as an industry, we’ve regressed across the board. Yes, this is only one data set of 15 builders compared with the old data set of 35, but the numbers are so consistent, we don’t expect significant change as we collect more data.
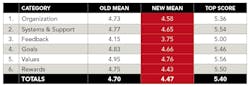
There’s not enough space here to examine all 45 questions, so let’s look at the six categories and a few particular questions in each. The chart, above, presents the old mean, new mean, and “all-time high” scores side by side. We run the best-ever score so builders will know what’s possible to achieve. This tends to dispel any notions of “well, that’s about as good as you can do on that one.” The questions are scored on a 6-point Likert scale, where 1 is the lowest and 6 is the highest.
Spend a minute scanning these results and some clear conclusions can be drawn, even with this high-level view. In all six categories, our post-crash builders score lower than those builders who got feedback prior to the downturn. The largest gap is “Feedback,” with a full four-tenths of a point drop. Statistically, that’s huge. “Rewards” also show a greater than three-tenths of a point drop from the old mean to the new. The smallest drops are found in “Systems & Support” and in “Organization,” so perhaps we can feel better about that. But comparing those scores with the top scores on the right will quickly take the wind out of your sails. If we compare any of the new mean scores to the top score, we find a huge chasm. And remember, the mean is the arithmetic average, making the distance from their score to the top score even greater for about half of our 15 surveyed builders.
To see almost a full-point shortfall for most of the categories, when compared with the top scores, should concern us all. Right now, some of you are wondering about “cherry-picking” the data. It’s a fair question. I was concerned about this too, as it’s possible there are builders spending inordinate, or at least nonproportional, time on one category and thus those scores aren’t realistic on a broad basis. But my concern vanished when last year a Georgia builder scored 5.27 overall. That’s slightly more than one-tenth of a point under the composite of all the top scores across 50 companies combined! This is something we never expected to see in TradeComm, but now we have. And what’s it tell us? Go ahead and ponder this while we consider more details.

Categorical Failure
Category 1: Organization. In this category, we cover schedules, plans, specifications, scope, contracts, site cleanliness, and safety. The good news is builders have held the line on plans and product specifications. But sites aren’t as well organized, clean, or safe, however, and scheduling has fallen way off the mark, with a huge increase in wasted trips to building sites. That isn’t the way to become the builder of choice and get the trades you so desperately need. It also drives up your costs.
Category 2: Systems & Support. In general, there’s a one-tenth of a point or a bit more drop in about half the questions covering systems, processes, paperwork, support staff, etc. One matter of concern is although the response to “Has well-trained, skilled employees who know their jobs” remained the same old to new, at 4.57, there was a significant falloff in other questions, which we might have also expected to remain steady. The trades dropped from 4.7 to 4.53 when answering “Builder cares about the success of every supplier and trade,” and we saw similar declines in “Hires the best suppliers and trades” and “Has employees who are proud of their company.” These point to significant morale issues within the ranks.
Since day one of the TradeComm survey, Category 3: Feedback, has always shown the lowest scores. This remains true, but the fall in scores from old mean to new mean is the largest of all, from 4.15 down to 3.75. Statistically, that’s huge, yet it’s one of the easiest of all gaps to fill. Put simply, builders aren’t sharing details on customer satisfaction, company performance, or future plans with suppliers and trades and rarely provide constructive feedback. Further, builders almost never ask for feedback from trades about how the builder is doing or about other trades on the jobsite. This is one of the lowest scores on the entire survey, despite the fact those taking the survey are doing just that—giving the builder feedback. This sends a strong message. Again, this is an “easy fix” category compared with most of the others.
Category 4: Goals once again shows a significant shortfall on each question, with a clear drop from before the housing crash to today. Every study of employee or partner satisfaction ever done makes one point clear: People want to feel a part of the success of the organization they work for. Without sharing company goals regarding continual improvement, customer satisfaction, supplier/trade relations, growth and the health of the business, we may as well put any talk of “partnering” aside.
Category 5: Values is another critical element that many overlook, yet every organizational behavior study confirms its necessity. This category asks about operating from a strong set of values and principles and the commitment to those by senior managers and employees, as well as suppliers and trades. Here we see noteworthy drops in every question. Values, commitment, and quality standards are all down. The final question is most concerning, “This builder always treats suppliers and trades with dignity and respect.” From a score of 4.91, the new mean is now 4.68. Compare that with our all-time best score of 5.59. Let’s be frank: There’s no excuse for this. And don’t kid yourself; it’s decidedly not all on the backs or your superintendents. It begins at the top and flows down through every level, every function. Without a solid score here in the 5’s, becoming a builder of choice is a mere fantasy.
Category 6: Rewards shows a significant drop, and as you peruse the questions, some of the responses are disturbing. We see nearly half-point drops on “This Builder rewards us for doing quality work—not just quantity,” and more than a three-tenths point drop on “Emphasizes prevention of problems, not just putting out fires.” The good news: Builders have held the line on “Pays in a timely manner,” but we see a more than two-tenths of a point fall in “Pays fairly for completed work.” Yet every builder out there believes they pay too much. Some of the most sobering data from the entire survey comes at the end of this category. Both “This is the best builder to work for in the market” and “I would highly recommend this builder to a friend” fell more than three-tenths to 4.35 and 4.83 respectively. The best-ever scores for these two questions are 5.75 and 6.0 (our first perfect 6). Imagine that! Seventy five of your suppliers and trades giving you a perfect 6.0 on whether they would highly recommend you to a friend. What would it take to achieve that? One clue is found in another question from Category 6, “Provides rewards other than money for working with them.” This never-stellar score dropped more than six-tenths of a point from the old mean of 4.2 to 3.57. That’s way beyond mere “statistical significance.”

Good News or Bad?
You may now be asking: What does it mean to provide rewards other than money to suppliers and trades, and does it matter? Let’s imagine for a moment that the top-scoring builder in your market also pulled down the top score on that question, just under 5? What if several of your competitors score higher than you across the board? Would that make a difference? Who wins the battle for the trades? How do you do it? Now you have the clues, so get busy and figure it out.
As stated up front, you can solve your trade shortage simply by writing bigger checks. There are always those trades who will chase the buck and put up with almost anything to get it. Those are never your top trades. We don’t want those who just chase the buck, but we do want those who methodically strive for profit—a huge difference. Your goal is not to pay them more than your competitors do. Your goal is to help them be more profitable, at a competitive price.
If we hadn’t seen this done many times, we could not in good faith challenge you to pursue it. It requires a cold, hard look at yourself. Do a self-assessment, ask trades for feedback, and show them they can trust you with the information. Don’t assume the sale on that one—the default is “no trust.” But what an opportunity! We know trades are rating us down from before the downturn, and they’re not happy about it. How do you think they’ll respond to one or two builders in your market who truly get it in terms of the care, feeding, development, and profitability of their suppliers and trades? Will one of those builders be you?
About the Author

Scott Sedam
Scott Sedam is president of TrueNorth Development, a consulting and training firm that works with builders to improve products, process, and profits. A senior contributing editor to Pro Builder, Scott writes about all aspects of the home building business and won the 2015 Jesse H. Neal Award, business journalism's most prestigious prize, for his commentary in Pro Builder. Scott invites you to join TrueNorth's Lean Building Group on LinkedIn and welcomes your feedback at scott@truen.com or 248.446.1275.