

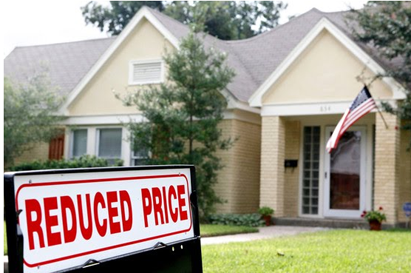
CoreLogic released Q2 negative equity data showing that 10.9 million, or 22.5 percent, of all residential properties with a mortgage were in negative equity at the end of the second quarter of 2011, down very slightly from 22.7 percent in the first quarter. An additional 2.4 million borrowers had less than five percent equity, referred to as near-negative equity, in the second quarter. Together, negative equity and near-negative equity mortgages accounted for 27.5 percent of all residential properties with a mortgage nationwide. The new report also shows that nearly three-quarters of homeowners in negative equity situations are also paying higher, above-market interest on their mortgages.
Negative equity, often referred to as "underwater" or "upside down," means that borrowers owe more on their mortgages than their homes are worth. Negative equity can occur because of a decline in value, an increase in mortgage debt or a combination of both.
Nevada had the highest negative equity percentage with 60 percent of all of its mortgaged properties underwater, followed by Arizona (49 percent), Florida (45 percent), Michigan (36 percent) and California (30 percent) (Figure 2).
Read the complete Negative Equity Report and download state and top 50 CBSA tables.
Advertisement
Related Stories

Market Data + Trends
Vacation and Investment Home Market Insights
A recent report finds beach homes to be the most sought-after vacation-home type and that the investment potential of a second home is an important factor in the purchasing decision

Affordability
How Much Income Do First-Time Buyers Need to Afford the Average Home?
The median-priced home is unaffordable in 44 of the 50 largest U.S. metro areas

Affordability
What Is the Relationship Between Urban vs. Suburban Development and Affordability?
A new paper from Harvard's Joint Center looks at whether expanding the supply of suburban housing could, in turn, help make dense urban areas more affordable

