

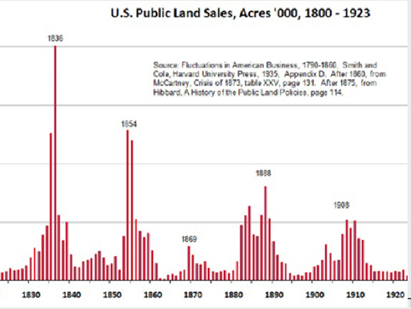
Business Insider posted an analysis by Philip J. Anderson of real estate bubbles throughout U.S. history, including slides showing graphs of the booms and bust of the housing market’s natural cycles.
"For the first 144 years of real estate enclosure in the U.S., land sales and/or real estate construction peaked almost consistently, every 18 years," Anderson writes. "The world’s worst downturns are always preceded by land speculation (the chasing of the economic rent) fueled by misguided credit creation courtesy of the banks."
To see the rest of the slides and read the full analysis, click here.
Advertisement
Related Stories

Affordability
What Is the Relationship Between Urban vs. Suburban Development and Affordability?
A new paper from Harvard's Joint Center looks at whether expanding the supply of suburban housing could, in turn, help make dense urban areas more affordable

Market Data + Trends
10 States Where Home Insurance Rates Have Risen the Most
Responding to the increasing number of natural disasters, insurers are hiking prices, with some states bearing the brunt more than others

New-Home Sales
Mortgage Rates Are Up but New-Home Sales Still Solid in March
Lack of existing home inventory drove a rise in new-home sales, despite higher interest rates in March

